How Field Variability Impacts Athlete
Quantifying variations in key metrics within and between natural and synthetic surfaces
By Ava Veith; David McCall, Ph.D.; Chase Straw, Ph.D.; Daniel Sandor, Ph.D.; Jay Williams, Ph.D.; Elisabeth Kitchen; Kevin Hensler; Aaron Tucker, Ph.D.; and Caleb Henderson, Ph.D.
A safe playing surface is essential for athletic competition; and key field characteristics such as surface hardness, rotational resistance, soil moisture, thatch depth and infill depth (for synthetic fields) play a crucial role in assessing field quality.
To improve field safety and optimize athlete performance, interdisciplinary collaboration among turfgrass scientists, sports scientists and sports medicine professionals is necessary. Evidence-based field management strategies must be developed to ensure more consistent playing conditions, reducing the risk of injury.
The objective of this study was to quantify the impact of surface variability on athlete safety and performance, both within and between natural turfgrass and synthetic turf surfaces. This research will quantify how variations in key surface metrics affect athletes utilizing data from wearable technologies such as GPS trackers and inertial measurement units (IMUs).
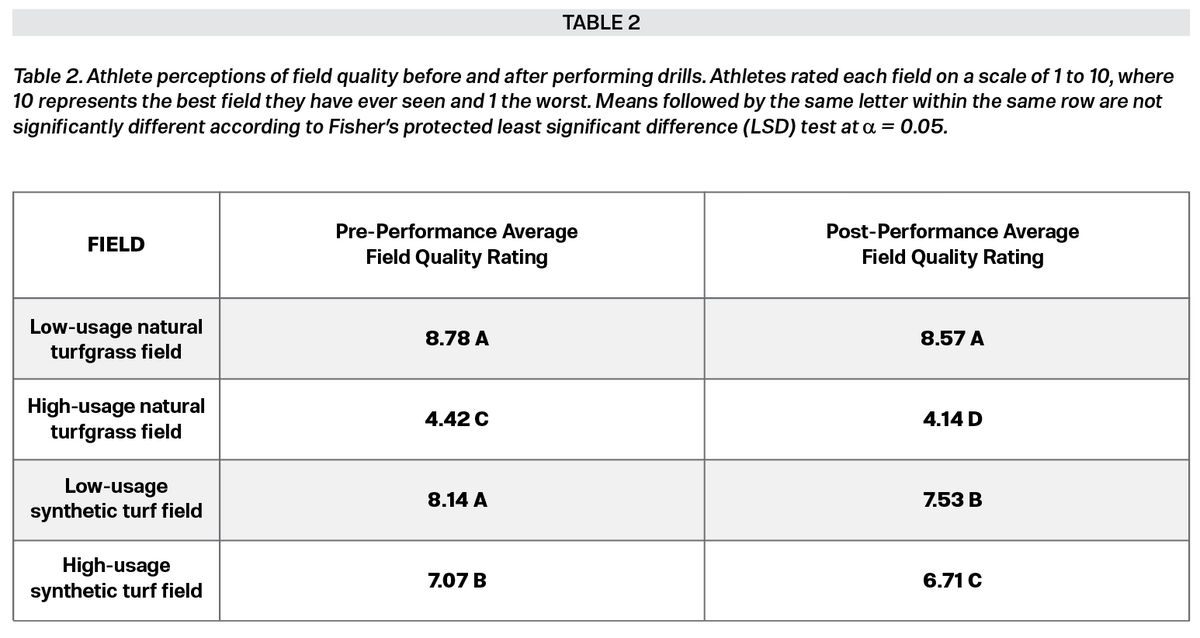
Additionally, to further understand the influence of field surfaces, athletes were surveyed before and after performing drills to gather insights into their perceptions of how surface variability impacts their performance.
Methodology
Athletic Fields Tested
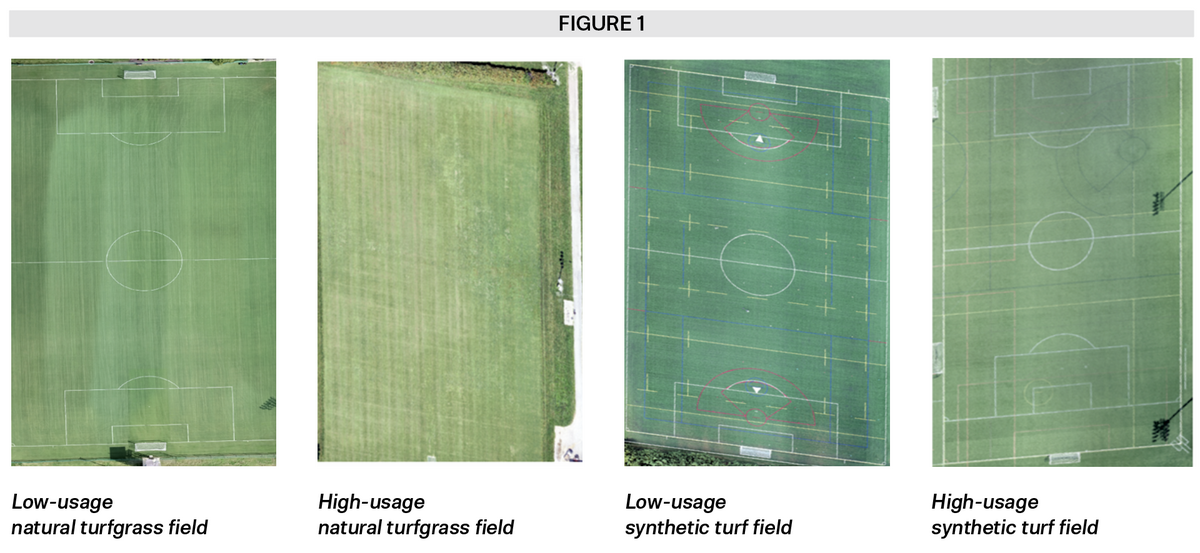
This research was conducted in August of 2024, during which four athletic fields on the Virginia Tech campus in Blacksburg, Virginia were studied (Figure 1). Two of the fields were natural turfgrass (bermudagrass) grown on native soil, where one was maintained at a mowing height of 1.59 cm, and the other at 2.54 cm. The other two fields were synthetic turf, both composed of slit-film fibers with a mix of sand and crumb rubber infill. For both field types, one field was classified as “low usage,” while the other was classified as “high usage.” This was determined based on traffic frequency, field age and management practices. Specifically, the low-usage natural field receives regular maintenance and is reserved for varsity athletics who use it a limited number of times per week on a scheduled basis. In contrast, the low-usage synthetic field, high-usage synthetic field, and high-usage natural field receive less frequent maintenance, and are accessible year-round to both the public and club sports teams. The low-usage synthetic field was approximately one year old at the time of this study, which is why it was still classified as low-usage.
Preliminary Data Collection
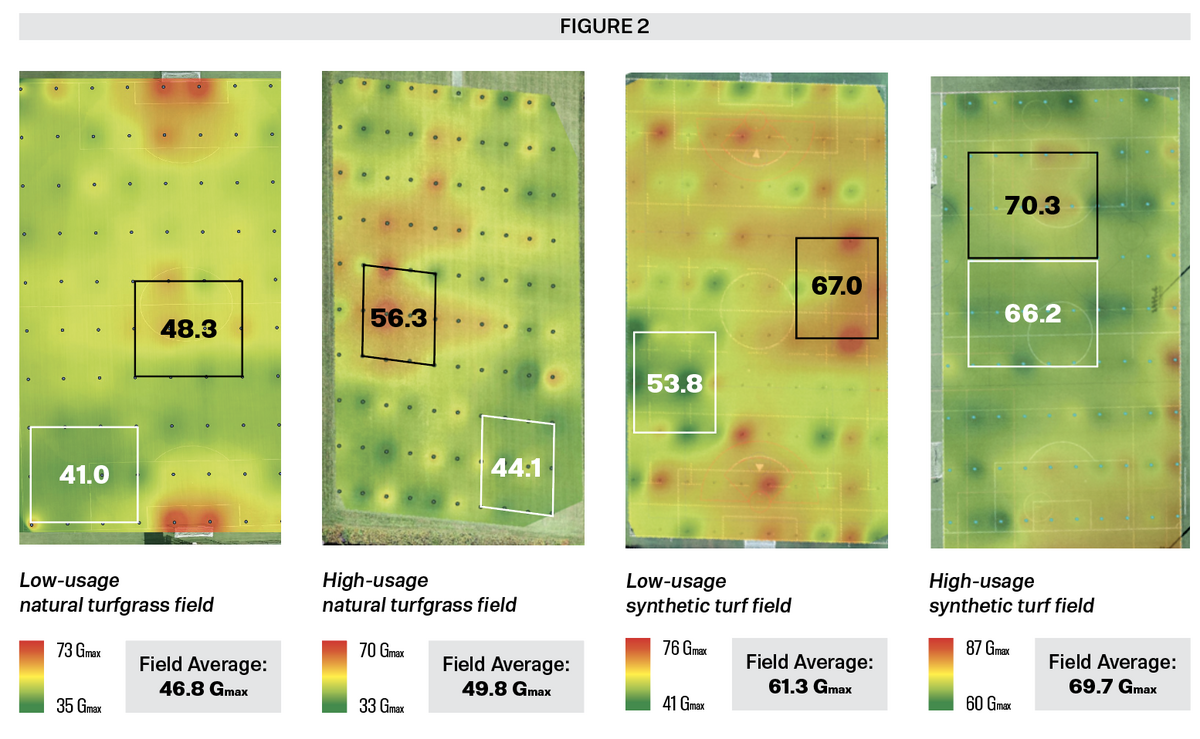
Prior to the introduction of live athletes, surface hardness was assessed on all four fields using a Clegg hammer, with 100 measurements collected per field. Surface hardness data were subjected to analysis of variance, and means were separated using Fisher’s protected least significant difference (LSD) test at = 0.05 to evaluate statistical differences between locations. The data were then analyzed using Arc-GIS Pro to generate surface hardness heatmaps, highlighting variability between and within each field. These maps allowed us to identify specific locations for the athletes to perform drills, where one selected area within each field was harder than the rest of the field, and the other being softer. Additionally, 20 measurements of rotational resistance (using Deltec’s rotational resistance tester), thatch depth (by extracting a soil plug with a profile sampler and using a tape measure to record thatch thickness), soil moisture (using a TDR 350 soil moisture meter) and infill depth (using a Turf-Tec Professional Model infill depth gauge) were taken in both the softer and harder areas to further characterize each field and understand the relationship between surface conditions and athlete performance.
Data Collection During Athlete Involvement
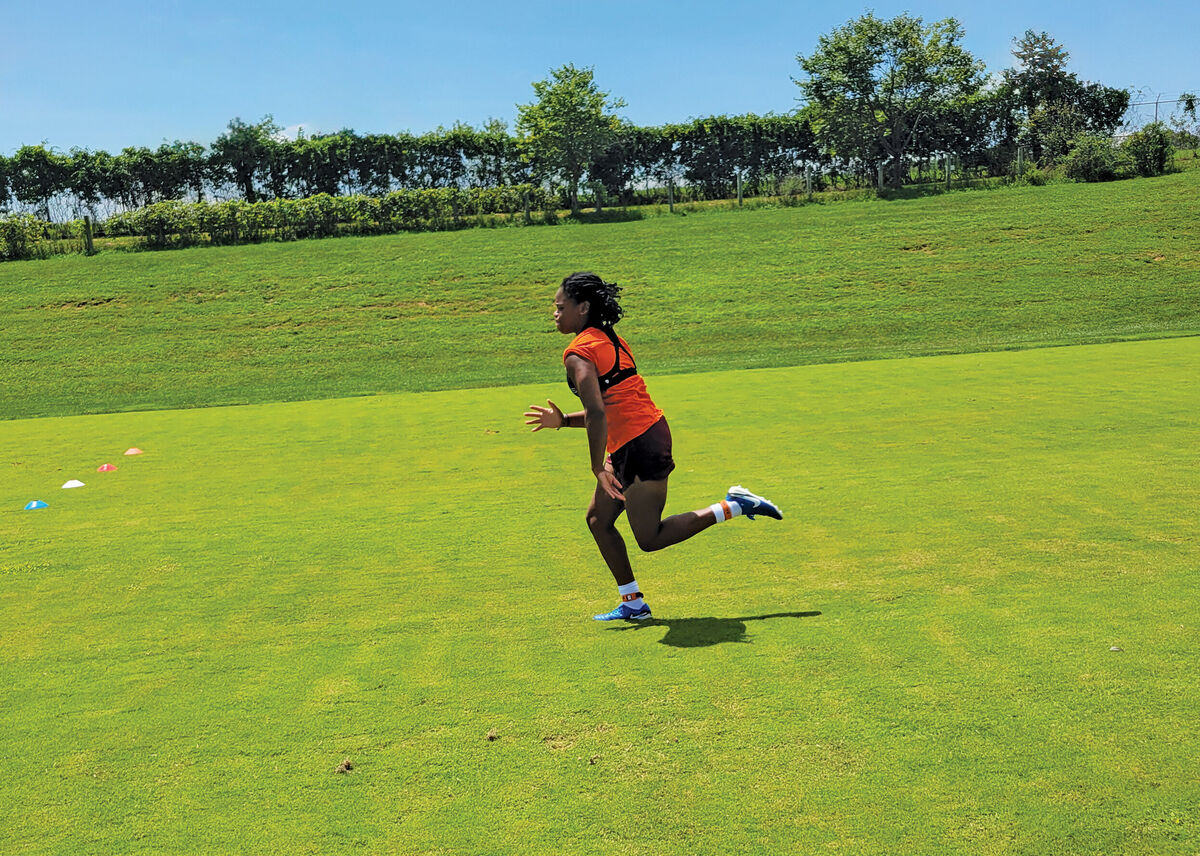
Fourteen female athletes participated in the study, and were equipped with STATSports GPS (STATSports, 2025) devices to measure running speed, as well as Vicon Blue Trident (IMeasureU, 2022) ankle IMUs to measure lower limb impact intensity. Both devices were used to quantify athlete movement during drills. The athletes were each given new Nike cleats prior to participation to eliminate variation based on cleat configuration. They completed three drills , including a drop landing or drop jump drill, a T- drill, and a modified acceleration-deceleration drill, which were designed to replicate common athletic movements. Each drill was performed three times in both the softer and harder areas identified within each field as shown in Figure 2. Additionally, each athlete completed pre- and postperformance surveys designed to capture their perceptions of field quality before and after completing the drills. This provided insight into how different surfaces may have influenced their performance.
Results and Discussion
Surface Hardness Data
Heatmaps shown in Figure 2 highlight surface hardness variability within each field studied. Both synthetic turf fields had significantly harder surfaces than the natural turfgrass fields (p < 0.001), and for both surface types, the high-usage field had a significantly harder surface than the low-usage field (p = 0.0029 for the natural turfgrass fields and p < 0.001 for the synthetic turf fields). Both synthetic fields tested in this study were not constructed with a shock pad, which is typically placed beneath the layer of material that supports the synthetic fibers and is utilized to help replicate the cushioning effect of natural turfgrass. The absence of a shock pad, along with the tendency of synthetic turf to harden over time due to infill material compaction from athlete foot traffic, may explain the harder surface values observed on the synthetic fields compared to the natural fields. Further, increased use or foot traffic on both natural turfgrass and synthetic turf leads to compaction, which causes the playing surface to harden over time. Therefore, it is anticipated that the high-usage fields exhibited higher surface hardness compared to the low-usage fields.
Data Within Each Hard and Soft Area
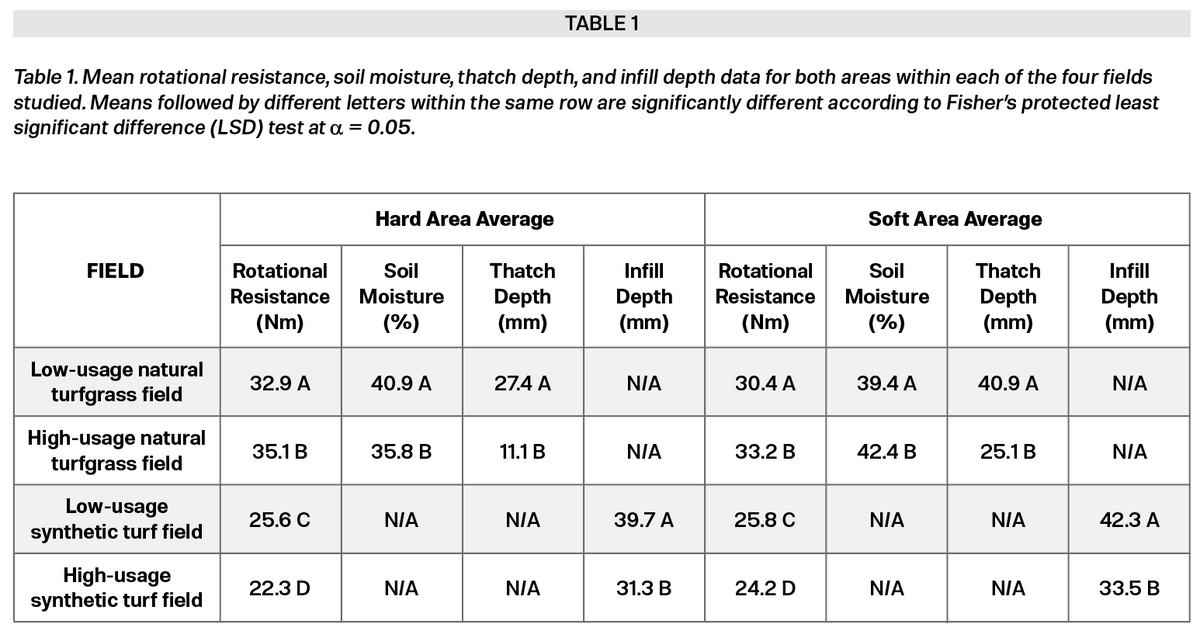
Resulting rotational resistance, thatch depth, soil moisture, and infill depth (synthetic fields only) measurements taken within each hard and soft area on all four fields are presented in Table 1. These measurements (n = 20 per both hard and soft areas within each field) were analyzed using analysis of variance, and means were separated using Fisher ’ s protected least significant difference (LSD) test at = 0.05 to evaluate statistical differences between locations.
Statsports GPS Unit Data
GPS units were securely attached to each athlete’s upper back , as shown in Table 2. These devices were used to determine if athlete running speed varied based on field type, field usage level, or hardness. However, no statistically significant differences were found. This consistency in speed across conditions is important because running speed can directly affect impact forces and biomechanical measurements. Prior studies have shown that faster running increases the ground reaction forces, which in turn raise lower limb impact loads (Leatham , 2004; Jiang et al., 2024). If athletes ran at different speeds across field types, it could have confounded interpretation of the ankle IMU data by introducing speed-related variation in impact load. However, since no significant speed differences were found across field types, usage levels, or hardness zones, we can more confidently attribute the observed differences in ankle IMU data to the playing surface.
Ankle IMU Data
Ankle IMUs were utilized to record a metric called average intensity, which is defined as the mean impact intensity derived from every impact propagated into both limbs (IMeasureU, 2022). This metric is recorded in units of gravitational force (g). The devices were securely attached to each athlete’s ankle and recorded data as the athletes performed drills on all four fields studied. After running statistical tests that accounted for individual differences between athletes, significant differences were found based on field type, usage levels, and hardness zones.
Across all three drills, field type had a noticeable impact (p < 0.0001) where athletes showed higher average intensity on synthetic turf fields compared to natural turfgrass. For the drop jump drill, the average intensity was 19.73 g [standard error (SE) ± 1.88] on natural turfgrass and 22.73 g (SE ± 1.82) on synthetic turf, placing the synthetic turf value within the IMU Step ‘high intensity’ foot strike range of 21.5 – 26.7 g (Wong and Finch , 2018). A similar trend was seen in the t-drill, with average intensities of 15.84 g (SE ± 1.20) on natural turfgrass and 18.07 g (SE ± 1.16) on synthetic turf. For the modified acceleration-deceleration drill, average intensity was 17.72 g (SE ± 1.15) on natural turfgrass and 21.35 g (SE ± 1.10) on synthetic turf.
Field usage also made a difference in the t-drill (p < 0.0001), where the average intensity on high-usage fields was 18.14 g (SE ± 1.24), compared to 16.49 g (SE ± 1.24) on low-usage fields. Hardness played a role as well, especially in the t-drill (p = 0.0073) and the modified acceleration-deceleration drill (p < 0.0001). In the t-drill, hard areas resulted in an average intensity of 17.43 g (SE ± 1.22), slightly higher than the 17.05 g (SE ± 1.22) on soft areas. For the modified acceleration-deceleration drill, intensity averaged 20.38 g (SE ± 4.28) on hard areas and 18.85 g (SE ± 3.81) on soft areas.
Overall, the synthetic turf fields, high-usage fields, and hard areas within fields exhibited higher average intensity values than natural turfgrass fields, low-usage fields, and softer areas. This pattern aligns with our surface hardness findings: synthetic turf fields were significantly harder than natural turfgrass fields on average, hard areas within synthetic turf were harder than those on natural turfgrass, and high-usage fields were harder than low-usage fields for both surface types. These results suggest that harder surfaces may contribute to the higher average intensity values recorded on the athletes’ lower limbs.
This trend is consistent with prior research showing that running on harder surfaces increases impact stress , which may contribute to lower limb injuries. However, all surface hardness values in this study were below 100 Gmax, the safety threshold defined by the NFL (Seifert, 2024; Sports Field Management Association, 2024 ) and FIFA (FIFA , 2022). Still, the observed positive correlation between surface hardness and ankle IMU intensity values indicates that higher surface hardness could elevate impact load. While further research is needed, surface conditions exceeding 100 Gmax could present a greater risk for injury over time due to increased impact loading. Establishing threshold values for ankle IMU metrics is also important for identifying impact levels that may lead to injury.
Survey/Athlete Perception Data
Athletes completed pre- and post-performance surveys to assess field quality and its impact on performance. Individual responses were analyzed using one-way analysis of variance (ANOVA) to assess statistical differences among fields. Post-hoc comparisons were conducted using Fisher’s protected least significant difference (LSD) test at = 0.05.
The low-usage natural turfgrass field received the highest quality rating on both pre- and post-performance surveys; while the highusage natural turfgrass field, hindered by weed encroachment and poor maintenance, scored the lowest. Synthetic turf fields ranked in between the two natural turfgrass fields, with the high- usage synthetic turf field rated lower than the low-usage synthetic turf field. These findings suggest a preference for synthetic surfaces over a poorly maintained natural turfgrass fields.
Conclusions
Considerable variation in surface hardness was observed both within and between fields, with synthetic turf fields generally being harder than natural turfgrass fields. High-usage fields, regardless of surface type, were significantly harder than lowusage fields. Other surface metrics — such as rotational resistance, soil moisture, thatch depth and infill depth — also showed variability. On natural turfgrass fields, higher soil moisture was associated with lower surface hardness. On synthetic turf fields, increased usage reduced infill depth, which in turn increased surface hardness.
Although perfect field uniformity is not achievable, these findings emphasize how field usage and maintenance impact surface variability.
Additionally, our data suggest a potential relationship between surface hardness and mechanical load on athletes’ lower limbs. While this trend was evident , further research is needed to investigate its long-term health implications, particularly on surfaces that exceed acceptable hardness thresholds.
Survey data revealed that athletes rated the low-usage natural turfgrass field the highest, likely due to its softer surface and better aesthetics. In contrast, the high-usage natural turfgrass field, affected by poor maintenance and weed pressure, received the lowest ratings, underscoring the influence of field condition on athlete perception. These findings highlight the importance of field management and athlete feedback in evaluating and improving field quality.
Overall , this study provides valuable insights into how sports surfaces affect athletes. The results suggest that harder surfaces, such as synthetic turf or high-traffic areas , may increase impact and loading on the lower limbs. This reinforces the importance of effective field management and careful consideration of surface conditions prior to athletic competition.
Ava Veith is a graduate research assistant at Virginia Tech, and a former Division I soccer player at Virginia Tech; David McCall, Ph.D., is associate professor, Turfgrass Pathology and Precision Management, Virginia Tech; Chase Straw, Ph.D., is assistant professor of turfgrass soils and the director of the Center for Sports Surface Research, Penn State; Daniel Sandor, Ph.D., is collegiate assistant professor, Turfgrass Science, Virginia Tech; Jay Williams, Ph.D., is collegiate professor, Department of Human Nutrition, Foods, and Exercise, Virginia Tech; Elisabeth Kitchen is graduate research assistant, Virginia Tech; Kevin Hensler is senior research specialist, Virginia Tech; M. Aaron Tucker, Ph.D.; and Caleb Henderson, Ph.D.
References:
-
Dickson, K. H., Straw, C. M., Thoms, A. W., Carson, T. D., & Sorochan, J. C. (2022). Impact of third generation synthetic turf athletic field age on surface hardness and infill depth spatial variability. Proceedings of the Institution of Mechanical Engineers , Part P : Journal of Sports Engineering and Technology, 236(3), 192-199.
-
Fédération Internationale de Football Association (FIFA). (2022). FIFA natural pitch rating system. Retrieved from https: /digitalhub.fifa. com/m/58aa765dd3e85f26/original/FIFAnatural-pitch-rating-system _EN.pdf
-
Jiang, X., Bíró, I., Sárosi, J., Fang, Y., & Gu, Y. (2024). Comparison of ground reaction forces as running speed increases between male and female runners. Frontiers in Bioengineering and Biotechnology, 12, 1378284.
-
Leatham, C. L. (2024). Tibial Acceleration and Shock Attenuation in Female and Male Distance Runners at Different Levels of Body Weight Unloading (Doctoral dissertation, Virginia Tech).
-
IMeasureU. (2019). IMU Step: Lower limb load monitoring. https: /imeasureu.com/imu-step/ - IMeasureU. (2022). Login. IMeasureU. https: / login.imeasureu.com/
-
Seifert, K. (2024, June 20). NFL, NFLPA sign off on new device to measure field conditions. ESPN. https: /www.espn.com/nfl/story/_/ id/41003011/nfl-nflpa-sign-new-devicemeasure-field-conditions
-
Sports Field Management Association. (2024). Natural grass athletic fields. SportsFieldManagement .org. https:/www.sportsfieldmanagement .org/natural-grass-athletic-fields/
-
STATSports. (2025). STATSports: The world’s leading GPS performance tracker. https: /statsports .com/
-
Wong, A., & Finch, M. (2018). IMU Step Dashboard Summary (Version 1.1.0). Vicon IMeasureU Limited. Retrieved from https: /imeasureu .com/wp-content/uploads/2018/02/ IMUStepDashboardSummary.pdf